k-means clustering is a useful unsupervised learning data mining tool for assigning n observations into k groups which allows a practitioner to segment a dataset.
I play in a fantasy baseball league and using five offensive variables (R, AVG, HR, RBI, SB) I am going to use k-means clustering to:
1) Determine how many coherent groups there are in major league baseball. For example,
is there a power and high average group? Is there a low power, high average, and speed group?
2) Assign players to these groups to determine which players are similar or can act as replacements. I am not using this algorithm to predict how players will perform in 2017.
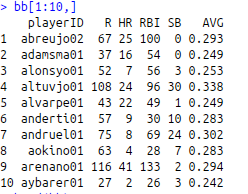
For a data source I am going to use all MLB offensive players in 2016 which had at least 400 plate appearances from baseball-reference This dataset has n= 256 players.

Sample data below
Step 1
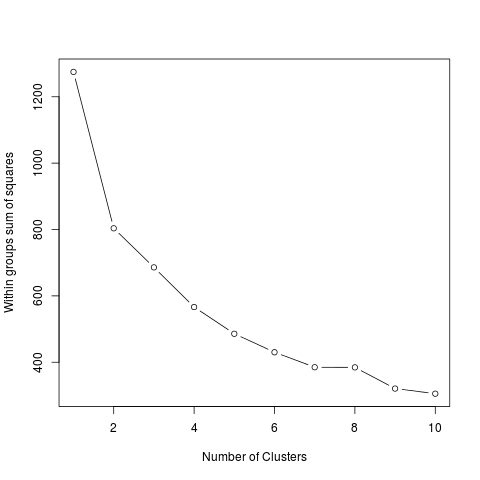
How many k groups should I use?
The within groups sum of squares plot below suggests k=7 groups is ideal. k=9 is too many groups for n=256 and the silhouette plot for k=9 is poor.
Step 2
Is k=7 groups a good solution?
Let's look at a silhouette plot to look at the fit of each cluster and the overall k=7 clusters.
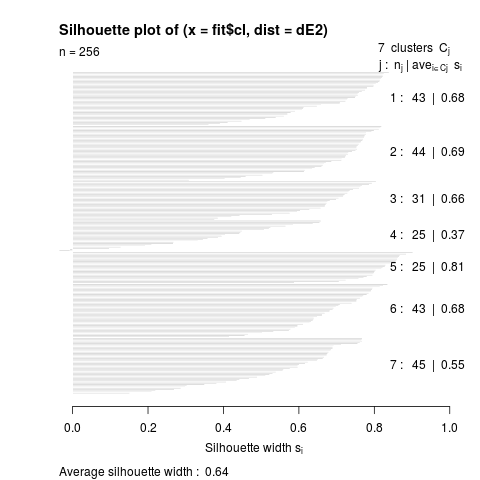
The average silhouette width = .64 indicates a reasonable structure has been found. Cluster 4 which is the speed group has a low silhouette width of .37. I am OK with this as it is the smallest group and speed is the hardest offensive tool to find in MLB.
Step 3
Calculate group means for k=7 groups

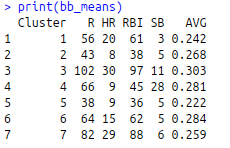
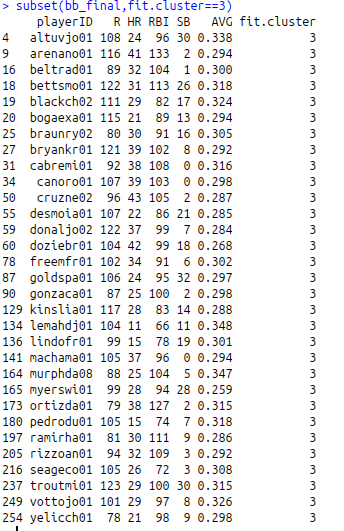
Players that are classified in cluster 3 are the elite players in MLB. Based on 2016 stats, 31 players make up cluster 3. On average they have the highest AVG, R, RBI, HR, and the second highest SB.