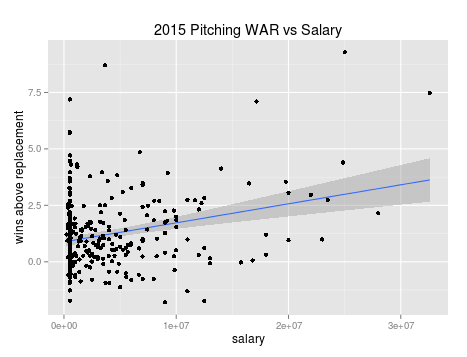
Are elite baseball pitchers worth their salaries? To investigate this I fitted linear and robust linear models using Baseball-Reference.com definition of wins above replacement. The universe of data is all pitchers in the year 2015 who started at least 20 games or as a reliever pitched 70 outs which is 298 players.
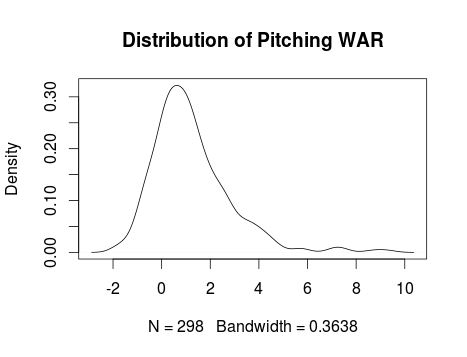
The distribution of war is below:
Min. 1st Qu. Median Mean 3rd Qu. Max.
-1.79 0.2125 0.95 1.219 1.905 9.28
standard dev: 1.61
mad: 1.245

Fitting a linear model to the data:


Investigating a robust model:

The robust model is a better fit as MSE is significantly lower at 1.47. The correlation between salary and war is slightly lower at .277. The advantage of a robust model is it will minimize outliers by assigning lower weights. The robust model suggests that each additional $14,065,063 in player salary should buy a win over a replacement player.
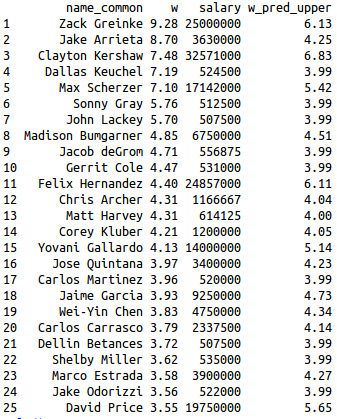
Below is a table of 2015 war, 2015 salary, and the upper prediction interval of war based on 2015 salary:

The top ten pitchers in 2015 all had better seasons than the upper end of the prediction interval based on their salary.
The distribution of war is below:
Min. 1st Qu. Median Mean 3rd Qu. Max.
-1.79 0.2125 0.95 1.219 1.905 9.28
standard dev: 1.61
mad: 1.245
Fitting a linear model to the data:
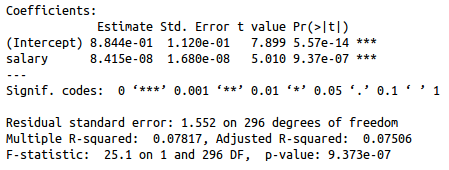
We can see that there is a linear relationship between salary and war as salary is significant. The correlation between the two variables is ~.28 but the MSE is 2.4 which indicates the model isn't the best fit. The linear model suggests that each additional $11,883,599 in player salary should buy a win over a replacement player.
Investigating a robust model:
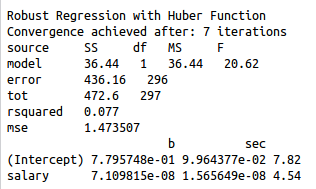
The robust model is a better fit as MSE is significantly lower at 1.47. The correlation between salary and war is slightly lower at .277. The advantage of a robust model is it will minimize outliers by assigning lower weights. The robust model suggests that each additional $14,065,063 in player salary should buy a win over a replacement player.
Below is a table of 2015 war, 2015 salary, and the upper prediction interval of war based on 2015 salary:
The top ten pitchers in 2015 all had better seasons than the upper end of the prediction interval based on their salary.